
Part 3: Linear Regression
Covers: Topics 2.4 - 2.9 of the Course & Exam Description (CED)
Stats Content (CED Topics 2.4-2.5)
Explanatory & Response
Describing Scatterplots
Correlation Coefficient (r)
Relevant Context
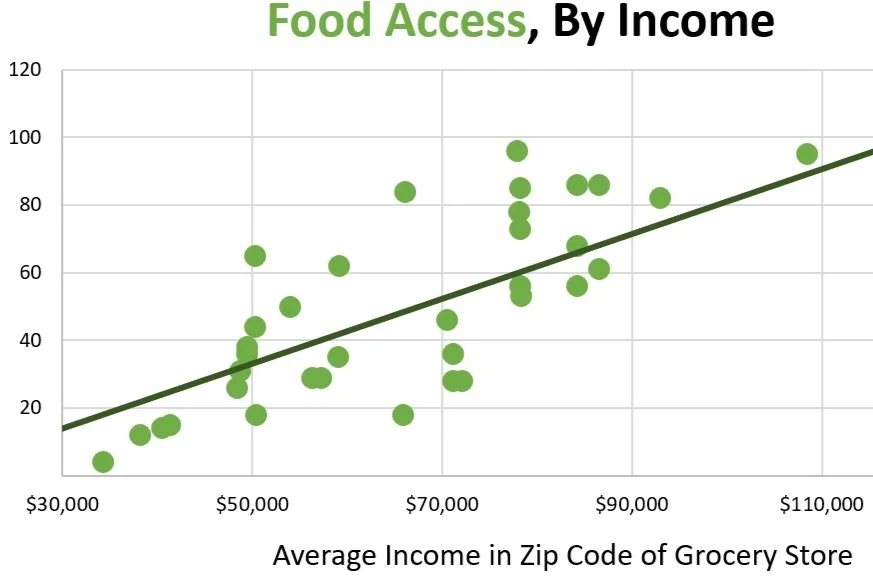
Income & Food Access
Correlation vs. Causation
Cartoon by Ameena Golding
Stats Content (CED Topics 2.6-2.8)
Least Squares Regression Line
Slope and y-intercept
Extrapolation
Relevant Context
Educational Inequity
Obesity & Public Health

Stats Content (CED Topics 2.7-2.8)
Residuals & Residual Plots
r², s
Outliers in Scatterplots
Relevant Context
Version A: The “Test Optional” Movement
Version B: Predictors of Mass Shootings

Stats Content (CED Topics 2.8-2.9)
Influential Points & Leverage
Regression Calculator Steps
Reading Computer Output
Relevant Context
Income & Food Access
Ethics of Prediction